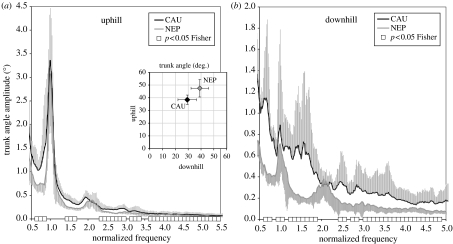
Figure 6.
The frequency spectra of trunk oscillation during (a) uphill and (b) downhill walking are plotted against normalized frequency (1.0 means the prevalent oscillation frequency, corresponding to the step cadence of 0.525 Hz in the mountaineers and 0.650 Hz in the Nepalese porters). Data for the different loads and locations were pooled. Vertical error bars represent positive (CAU) and negative (NEP) amplitude standard deviations. Oscillation variability, compared using Fisher's tests for the same normalized frequency ranges (0.1 intervals), was found to be significantly greater in mountaineers (CAU) for most of the investigated range (open squares). The inset graph shows the different average trunk angles (uphill versus downhill) associated with the two groups/carrying tools (0° means vertical trunk).

