
Figure 3.
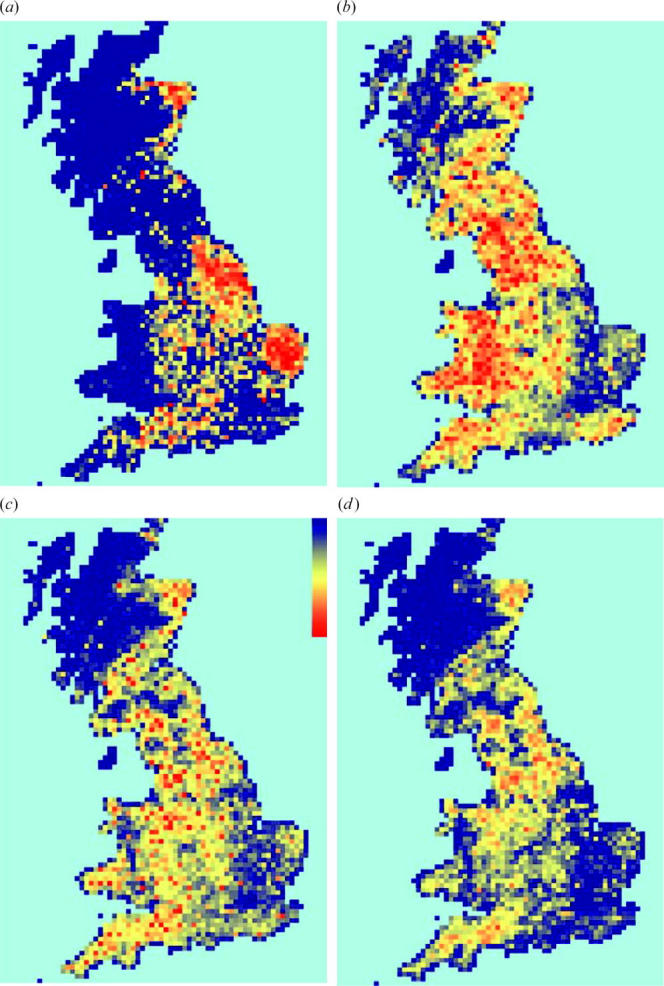
(a–c) Distributions of the numbers of animals moved across the whole 2003–2004 movements data: (a) pigs (26×106), (b) sheep (51×106) and (c) cattle (24×106). (d) IP distribution at the autumn 2004 peak in sheep trading (full model). Blue indicates low density and red, high.