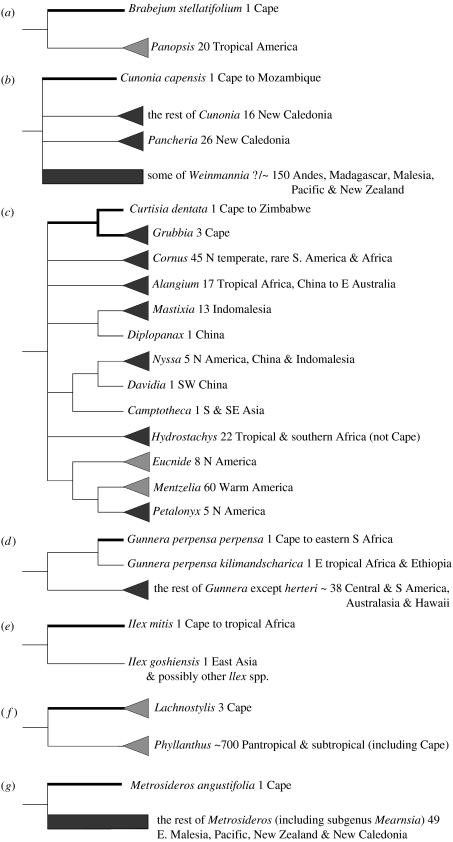
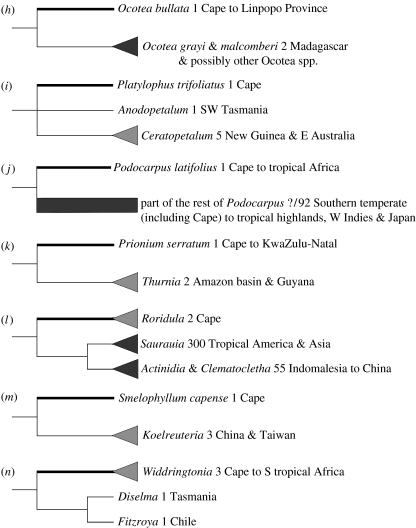
Figure 1.
Stylized representation of Cape–non-Cape nodes for which divergence time minima were estimated. The rest of each phylogeny, including nodes of calibration, is omitted. Putative relict Cape lineages are represented by thick branches emanating from the nodes being dated, while their non-Cape (or partially non-Cape) relatives are represented by thin branches. ‘Cape’ refers to the area covered by Goldblatt & Manning (2000). Dark triangles, the subset of available samples for the group supports its monophyly; dark rectangles, the subset of available samples for the group demonstrates that it is non-monophyletic, and that two or more sections emanate from the proximal node; light triangles, the group is only represented by one sample, and there is therefore currently no molecular phylogenetic evidence for or against its monophyly. (a) Brabejum; (b) Cunonia; (c) Curtisia-Grubbia; (d) Gunnera; (e) Ilex; (f) Lachnostylis; (g) Metrosideros; (h) Ocotea; (i) Platylophus; (j) Podocarpus; (k) Prionium; (l) Roridula; (m) Smelophyllum and (n) Widdringtonia.


