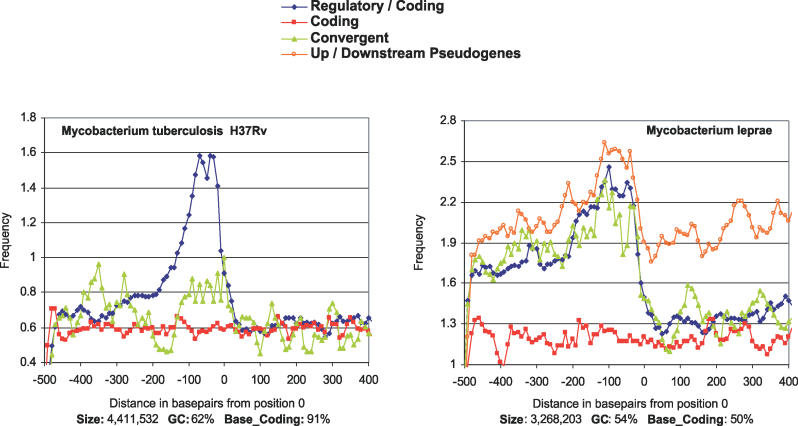
Figure 4. Signal Density in Regulatory versus Nonregulatory Regions of M. tuberculosis and M. leprae .
M. leprae shows an increase of promoter-like signals in the upstream and downstream regions of pseudogenes relative to the regulatory regions. M. leprae contains over 1,115 recognizable pseudogenes [20]. Both 500 bp upstream and downstream of the start of pseudogenes (position 0) were analyzed for searches of promoter-like signals. All other region definitions and methodology are as in Figure 3.

