
Fig. 2.
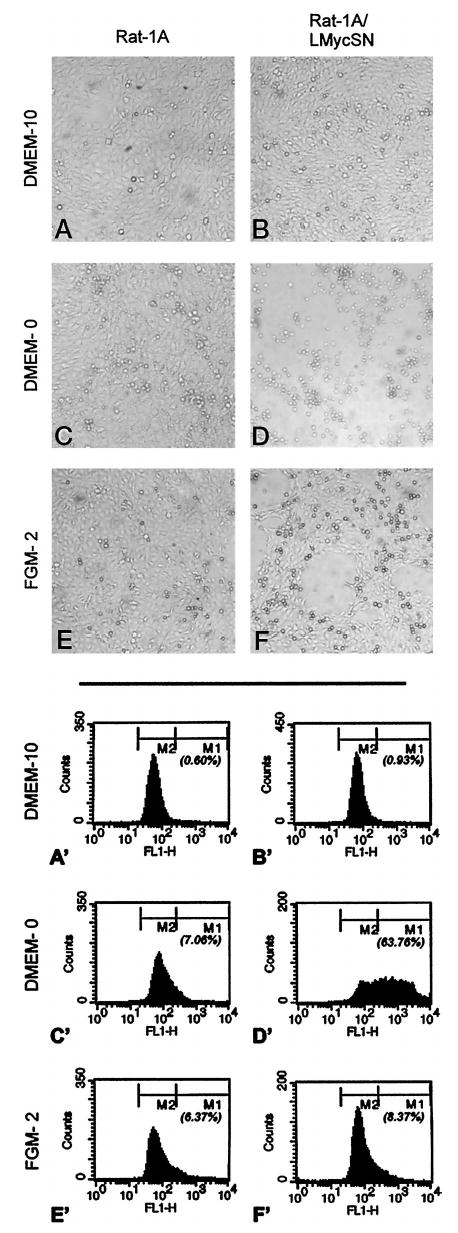
Analysis of cell viability on culturing in different media. A–F, phase-contrast microphotographs of Rat-1A and Rat-1A/LMycSN cells incubated in DMEM supplemented with 10% (DMEM-10) or 0% FCS (DMEM-0) or in FGM-2. A′–F′, flow cytometry profiles of the same cultures on fluorescent staining for DNA breaks. M1 and M2 populations refer to apoptotic and viable cells, respectively; numbers below M1 refer to the percentages of apoptotic cells.