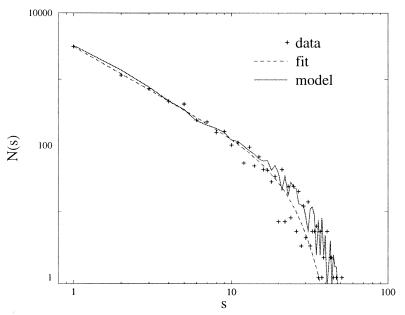
Figure 5.
School size distribution of free-swimming tuna fish aggregated over 7 yr (same as Fig. 1). The dotted line corresponds to a fit of the type a s−be−(s/sc)c, with a = 3,497, b = 1.49, c = 2, sc = 29.7. The solid line has been obtained with the mean-field model (P = 0.1).

