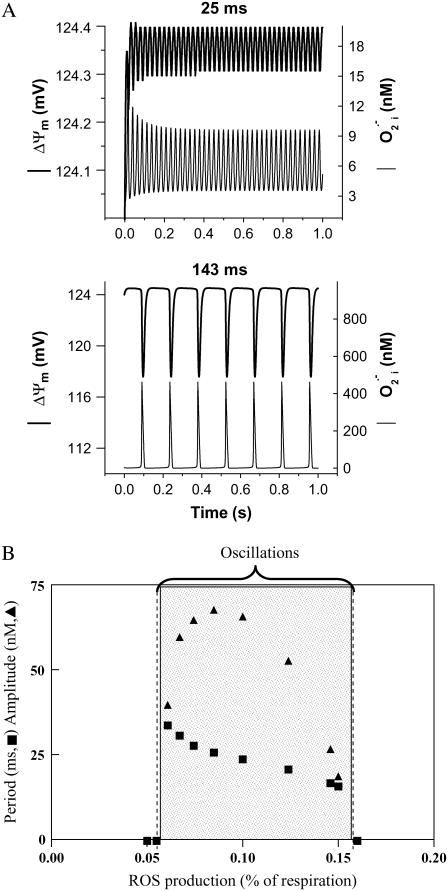
FIGURE 2.
Frequency and amplitude modulation of the mitochondrial oscillator model through changes in the balance between ROS production and ROS scavenging. (A) Oscillation periods of 25 ms and 143 ms are shown for SOD concentrations of 0.75 μM and 1.07μM, respectively. The model parameters used to run the simulations for shunt = 0.0744 (defined as the fraction of the electron flow in the respiratory chain diverted to the generation of superoxide anion,  ) were concentration of respiratory chain carriers, ρREN = 2.5 × 10⁻⁶ mM; concentration of F1F0 ATPase, ρF1 = 2.03 × 10⁻³ mM; [Ca2+]i = 0.1 μM; Kcc = 0.01 mM;
  = 2.4 × 10⁶ mM−1s−1;
  = 1.7 × 10⁴ mM−1s−1; GT = 0.5 mM; maximal rate of the adenine nucleotide translocase, VmaxANT = 5 mM s−1; maximal rate of the mitochondrial Na-Ca exchanger,
  = 0.015 mM s−1. The
  concentrations correspond to the mitochondrial matrix space and were calculated as described in Cortassa et al. (14). Remaining parameters were set as described in Cortassa et al. (10) and Cortassa et al. (14). (B) Under similar parametric conditions, the frequency and amplitude of the oscillations in
  delivered to the cytoplasm as a function of the fractional
  production in the high-frequency domain (ms). Within the oscillatory region (shaded), the oscillatory period constantly decreased, whereas the amplitude reached a peak and then decreased as a function of the increase in ROS production. A similar analysis was performed in the low-frequency domain (seconds to minutes) for SOD concentrations of 1.87 μM (not shown). In the latter case, the amplitude of
  (0.86 mM) did not change as a function of the shunt (from 0.05 to 0.25), whereas the period decreased from 276 s to 62 s, respectively.

