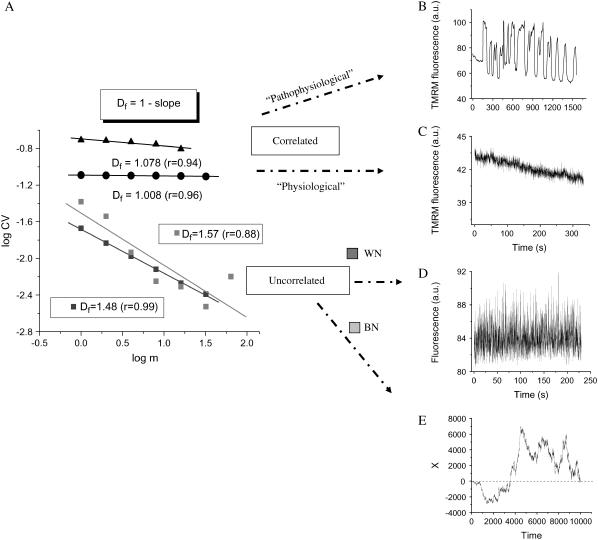
FIGURE 3.
RDA of the TMRM fluorescence time series from the mitochondrial network of cardiomyocytes. Freshly isolated ventricular cardiomyocytes were loaded with 100 nM TMRM and imaged by two photon microscopy, as described in Materials and Methods. The statistical analysis of the TMRM signal showed that the mitochondrial network of the heart cell functions as a highly correlated network of oscillators. (A) RDA: A log-log plot of the CV (= SD/mean) of the fluorescence distribution obtained at increasing values of the aggregation parameter, m (see also text), gives a fractal dimension, Df, close to 1.0, either for myocytes showing large (“pathophysiological”) oscillations in ΔΨm (panel A, solid triangles, and panel B) or those under “physiological” conditions (panel A, solid circles, and panel C). A completely random process obtained from the noise in the image background (panel D) (in fact, corresponding to the images shown in panel C) gives Df = 1.48 (∼1.5; panel A: WN, white noise, dark gray squares). The position of a Brownian particle as a random function of time simulates brown noise (panel E), Df = 1.57 (∼1.5; panel A: BN, brown noise, light gray squares) (see also Supplementary Material). The data obtained from RDA were subjected to linear regression and the slope calculated. Df was obtained as described in panel A.

