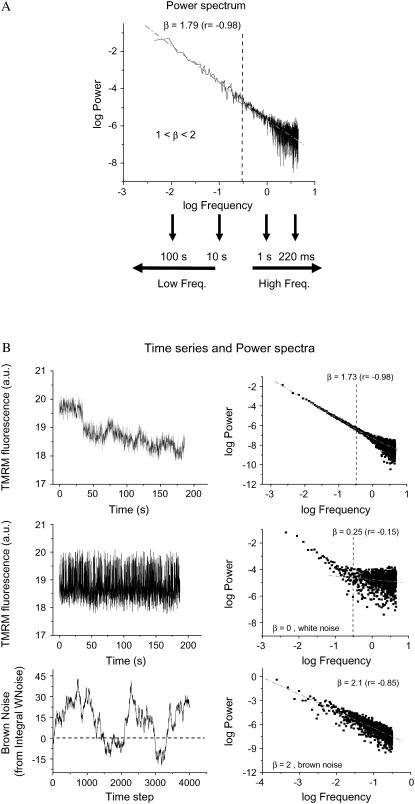
FIGURE 4.
PSA of TMRM fluorescence time series from the mitochondrial network of cardiomyocytes. Experiments were carried out as described in the legend of Fig. 1 and Materials and Methods. The time series of TMRM fluorescence was subjected to FFT as described in Materials and Methods. (A) PSA: The power spectrum was obtained from the FFT of the TMRM signal as the double log plot of the amplitude (power) versus the frequency. This relationship obeys a homogeneous power law (1/fβ; with f, frequency, and β, the spectral exponent) and is statistically self-similar, which means that there is no dominant frequency. The PSA reveals a broad spectrum of oscillation in normally polarized mitochondria with a spectral exponent of β = 1.79, whereas a random process (white noise) gives a β ∼ 0, meaning that there is no relationship between the amplitude and the frequency in a random signal. A β = 1.0 (Supplementary Material, Fig. S3) or 2.0 (Fig. 4 B, bottom panels) corresponds to pink or brown noise, respectively. The inverse power law spectrum arises from the coupling of frequency and amplitude in an orderly statistical sequence. The periods, in seconds or milliseconds, at the bottom of panel A are intended to facilitate the interpretation of the high- and low-frequency domains of the spectrum. (B) When the time series of the TMRM fluorescent signal is randomized (mid, left), we obtain a value of β close to zero (mid, right) as opposed to a β = 1.79 in the nonrandomized signal (right, top). The spectral exponent β = 1.79 (right, top) is consistent with long-range correlations that after signal randomization becomes white noise, with loss of correlation properties β = 0.25 (≅ 0) (mid, right) (12).

