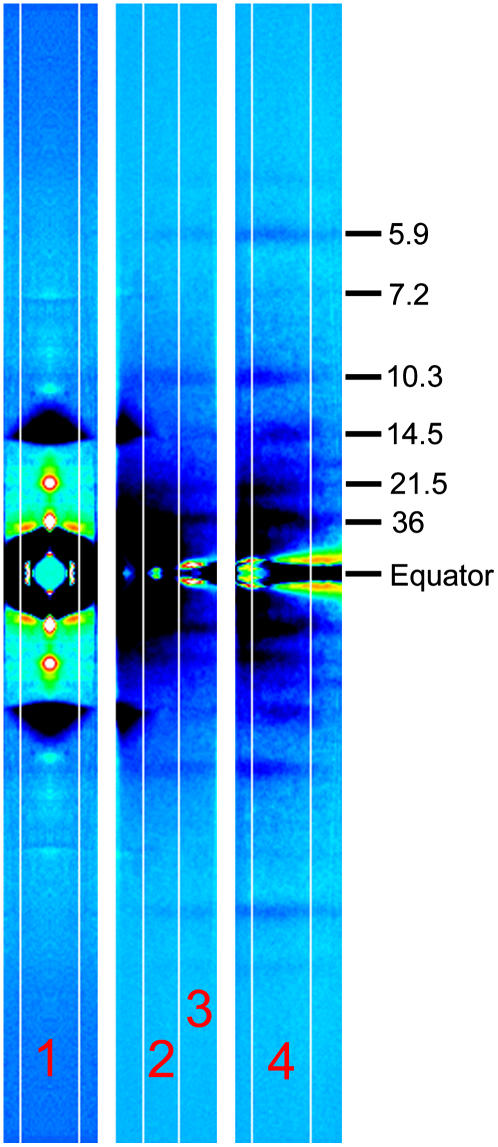
FIGURE 1.
Difference diffraction patterns recorded with different shifts of the detector. The difference was obtained by subtracting the pattern before the muscle release from that at 13 ms after the beginning of the release. The black-dark blue regions indicate decrease of intensity, whereas light blue-yellow-red-white regions indicate increase. The numbers in the right are approximate Bragg spacings. The pattern in the left is the meridional region (summation of 100 patterns from five muscles), which was obtained by averaging four quadrants. The middle pattern is the off-meridional region (100 patterns from nine muscles). The right pattern is the layer line region (107 patterns from 12 muscles). The contrast level is different for each image. The two sides of the equator were averaged in the off-meridional and layer line patterns. The vertical strips numbered 1–4 indicate the areas along which the intensity profiles were obtained. These patterns do not show the entire recorded area because part of the area was not usable for analysis due to the tilt of the muscle. The 7.2-nm meridional reflection looks enhanced due to the shift of its position. The 21.5-nm layer line indicates the position of the meridional reflection in region 1. The layer lines between 36 nm and 14.5 nm are at Bragg spacings of 23 nm and 18 nm, whose intensity was difficult to measure because they were so close to each other.

