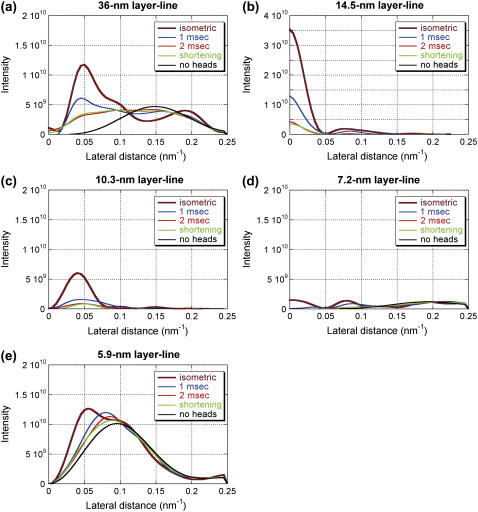
FIGURE 6.
Intensity distribution along major layer lines calculated with various models of myosin attachment to the thin filament: (a) the 36-nm actin layer line; (b) the 14.5-nm myosin layer line; (c) the 10.3-nm actin-myosin layer line; (d) the 7.2-nm myosin layer line; and (e) the 5.9-nm actin layer line. The ordinate is in an arbitrary scale. The thick brown line is for a model with 80% PRE and 20% POST conformation with isometric occupancy (0.56 × 0.3), representing a cross-bridge state in isometric contraction. The red line is for a model with 20% PRE and 80% POST conformation with 70% isometric occupancy, representing a cross-bridge state at 1 ms after the beginning of the release. The thick green line is for a model with 20% PRE and 80% POST conformation with 50% isometric occupancy, representing a cross-bridge state at 2 ms after the beginning of the release. The black line is for a model with 30% PRE and 70% POST conformation with 38% isometric occupancy, representing a cross-bridge state in isotonic shortening. The blue line is for a model without myosin heads. To obtain intensity distribution along layer lines, background was subtracted by linearly connecting the intensity on the two axial sides of each layer line. The inner part of the 36-nm layer line has negative intensity due to the presence of a weak neighboring layer line. The 7.2-nm layer line includes not only the myosin layer line but also contribution from the actin 7.0-nm layer line.

