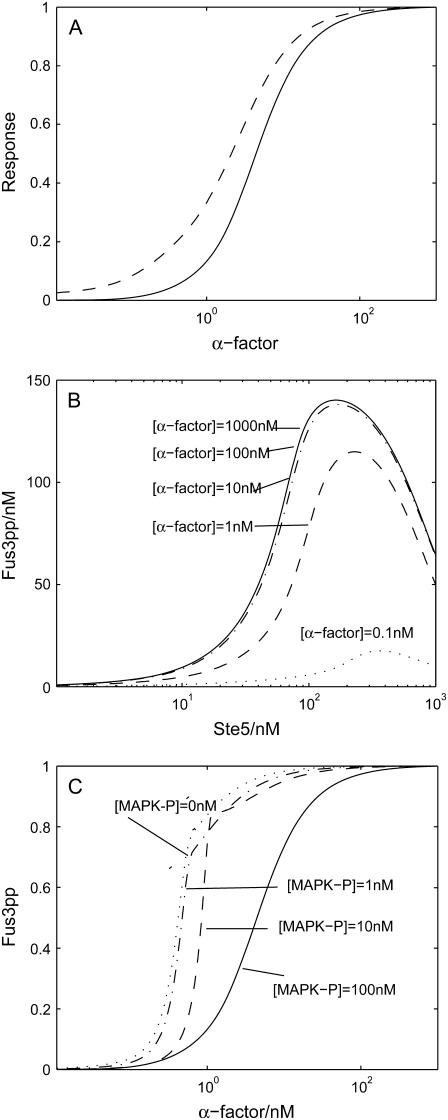
FIGURE 5.
(A) Predicted dose-response curves of recruitment of scaffold protein Ste5 (dashed line) and activation of Fus3 (MAPK) (solid line). (B) The dependence of Fus3pp on the concentration of scaffold proteins Ste5, with different concentration of α-factor. (C) Predicted dose-response curves for mutants in which MAPK-P is underexpressed. All the values are normalized. In all these simulations, cells are treated as indicated with α-factor for 20 min.

