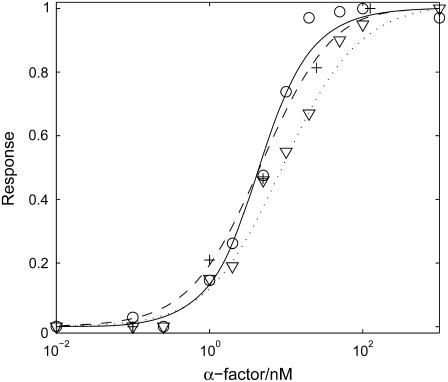
FIGURE 8.
Dose-response curves for key components in the mating pathway in TMY101 cells: activated Ste2 (dotted line for simulation, down-triangles for experiment data from (12)); G protein activation, i.e., the sum of Gα-GTP and Gα-GDP (dashed line for simulation, circles for experiment data from (12)); and Fus3pp (MAPK) (solid line for simulation and crosses for experiment data from (45)).

