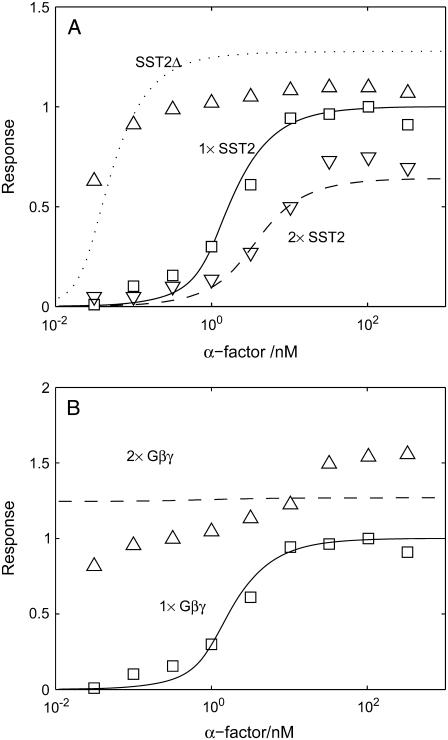
FIGURE 9.
Response curve of Ste12 to α-factor for (A) different Sst2 expression level; and (B) different Gβγ expression level. To simulate the 2 × Gβγ cells, we separately add another 1000 nM Gβγ at t = 0 min to double the total concentration of Gβγ. Cells are treated with α-factor for 60 min. Note that the experiment data are shifted left by >100-fold because Bar1 is deleted in TMY101 cells. Experiment data are from Hao et al. (8).

