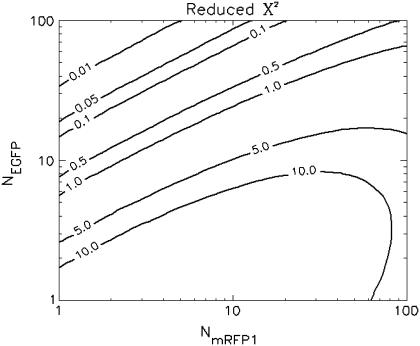
FIGURE 2.
Contour plot of the reduced  due to the misfit between a two-species dual-color PCH and a single-species model as function of
  and
and  . Contours with
  indicate regions in which EGFP and mRFP1 can be resolved, whereas contours with
  indicate regions in which they cannot. Favorable conditions for resolving the two species include low concentrations and more mRFP1 than EGFP. The number of data points used in the modeling was 2.6 × 10⁶, corresponding to an acquisition time ∼2 min at a sampling frequency of 20 kHz.

