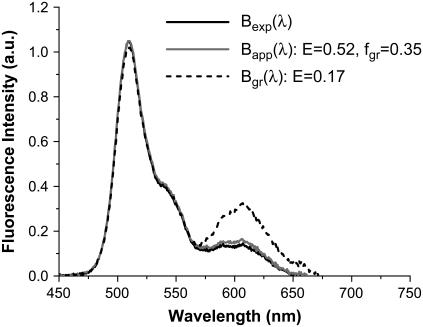
FIGURE 4.
Brightness spectrum  of EGFP-mRFP1 (solid black) expressed in COS cells. Also shown is the expected apparent brightness spectrum
  for a sample composed of 65% EGFP and 35% of fluorescent EGFP-mRFP1 with a 0.52 FRET efficiency (gray solid). A single-species model (
 ) with
  (dashed black) fails to describe the experimental spectrum in its entirety.

