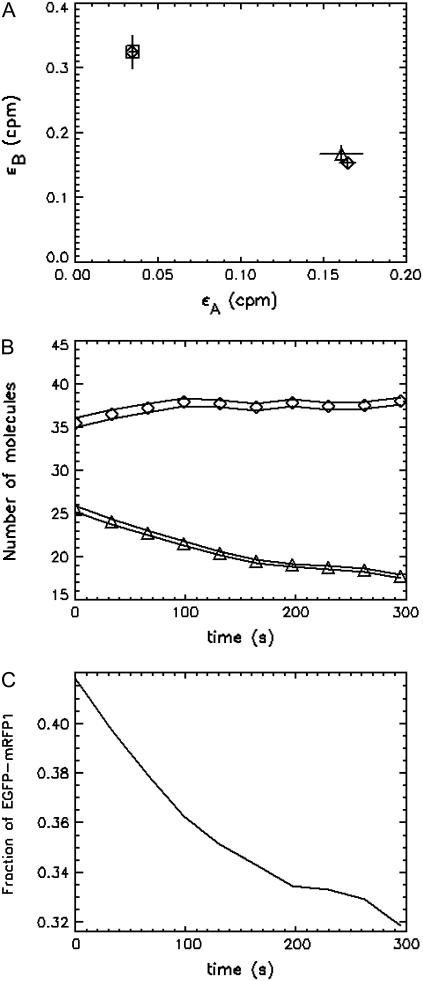
FIGURE 6.
Cell expressing EGFP-mRFP1 was measured for a period of 5.5 min. The data were subsequently divided into 10 segments and 10 histograms were formed. The histograms were globally fit to a two-species model, and the brightness values returned by the fit (⋄) are shown in A and indicate that one is EGFP-mRFP1† (□) and the other is EGFP-mRFP1 (▵) with 54% FRET efficiency. The number of molecules of EGFP-mRFP1† and EGFP-mRFP1 as a function time are shown in B. The lines indicate the error in the concentration. The EGFP-mRFP1† concentration increases as a function of time, whereas the EGFP-mRFP1 concentration decreases because the mRFP1 in the EGFP-mRFP1 fusion protein is being photobleached. (C) The fraction of fully fluorescent EGFP-mRFP1 as a function of time. The initial fraction of EGFP-mRFP1 was 42%, in good agreement with our other measurements.

