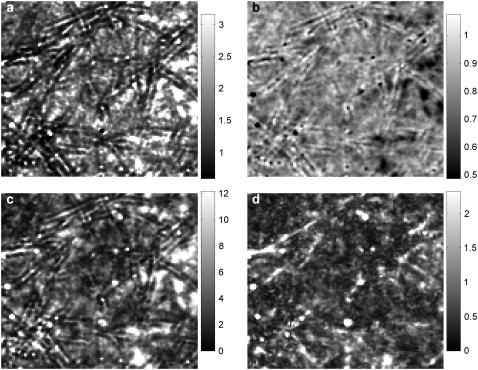
FIGURE 7.
Anomalous diffusion in collagen. (a) The map of diffusion coefficient Da, as in Fig. 5 d, except with the anomalous parameter allowed to vary, giving (b) the corresponding map of best fit α. The units in panel a are μm2/s. (c) The summed square difference of the autocorrelation and the fit for α fixed at 1, and (d) with α allowed to vary. The scales in panels c and d have been multiplied by 103. The mean of Da is ∼80% bigger than the mean of D (in Fig. 5 d). The mean and standard deviation of panel c are both ∼5 times larger than those of panel d. Much—but not all—of the filamentous structure in the residuals is removed when α is allowed to vary.

