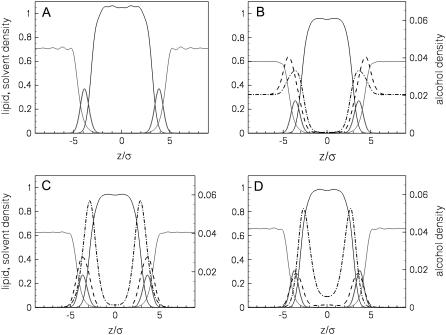
FIGURE 2.
Density profiles: (A) pure lipid bilayer; (B) at 3.4% ethanol; (C) at 0.12% butanol; and (D) at 0.00048% hexanol. The curves show the lipid tailgroups (solid black curves), lipid headgroups (thick shaded curves), solvent (thin shaded curves), OH groups (dashed curves), and alcohol tails (dash-dotted curves).

