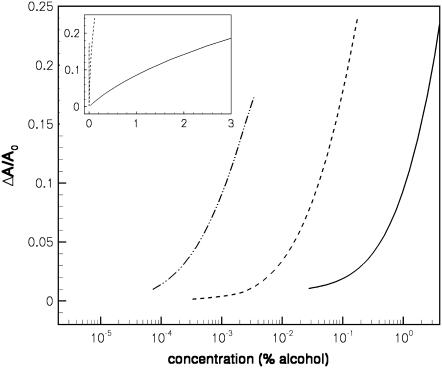
FIGURE 3.
Change in the area per lipid as a function of the concentration of alcohol in the aqueous solution outside the bilayer, showing results for ethanol (solid curve), butanol (dashed curve), and hexanol (dot-dashed curve); the area per lipid at zero alcohol concentration is AL0 = 4.9σ2. The inset shows the same results on a linear concentration scale.

