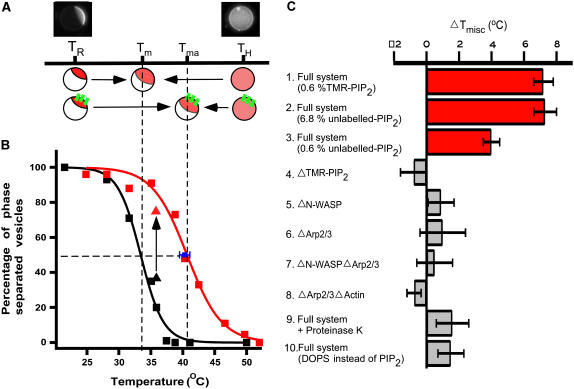
FIGURE 2.
Shift in Tmisc due to membrane-associated actin networks. (A) Illustration of domain stabilization by actin networks. Tma and Tm denote Tmisc for the vesicles with and without actin, respectively. TR and TH indicate room temperature and high temperature, respectively. (B) Tmisc increases for GUVs associated with an actin network (red squares) compared to those without (black squares). Tm and Tma were determined to be 33.4°C ± 0.5°C and 40.6°C ± 0.3°C by fitting the data points to a sigmoidal curve (black and red line). When actin was polymerized at TH, Tmisc of individual vesicles (n = 3) was found to be 40.3°C ± 0.8°C (blue square) by lowering temperature. (C) Dependence of Tmisc shift on model system composition. A substantial increase in Tmisc was not observed when N-WASP or TMR-PIP2 were omitted from the model system (bars 4 and 5), indicating that PIP2-N-WASP linked through actin filaments is responsible for the observed increase in Tmisc. When the actin network was removed from membrane by incubation with Proteinase K or when TMR-PIP2 was replaced by DOPS, a substantial increase in Tmisc was not observed (bars 9 and 10). However, when TMR-PIP2 was replaced with unlabeled-PIP2, a significant increase in Tmisc was measured (bars 2 and 3). Phase separation of membrane was determined by lis-DPPE fluorescence for bars 2, 3, and 10, and fluo-DOPE for all other experiments. Tmisc was determined as in B.

