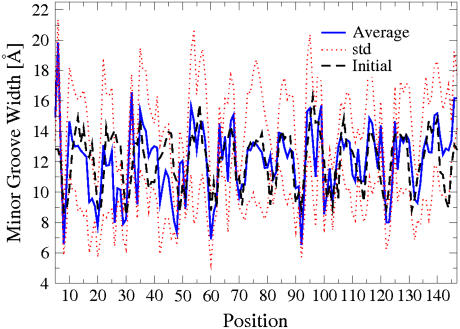
FIGURE 3.
Minor groove width of the bases of the nucleosomal DNA (WholeNCP-DNA) during the 1 ns MD simulation. Thick blue solid line, values averaged over last 500 ns of the MD; the corresponding standard deviations are shown as red dotted lines. For reference, the initial values of minor grove width are also shown (black dashed line). An extreme narrowing of the minor groove occurs near a region located at ±15 basepairs from the dyad.

