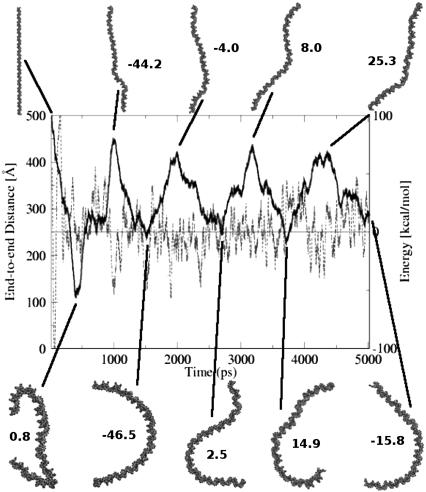
FIGURE 5.
End-to-end distance (thick solid line) of the free B-DNA during the course of the 5 ns MD simulation at room temperature. Horizontal line represents the average potential energy of the last 4 ns. Dashed line is a running average of the potential energy over a window of 25 data points; this energy includes the molecular mechanical energy and the free energy of solvent rearrangement (see Methods). Some of the structures and their corresponding energies relative to the 4 ns average are also shown. The DNA helix is shown as a VDW representation. (The complete MD trajectory is available as a movie at http://people.cs.vt.edu/%7Eonufriev/RESEARCH/DNA.html.)

