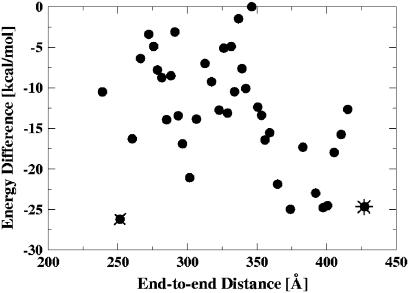
FIGURE 6.
Conformational energy as a function of the end-to-end distance of the nucleosomal DNA free in solution (Free-DNA). Each point represents an average over a bin of 100 structures: the average energy and distance for each bin is shown. The lowest-energy bent and straight conformations are denoted by an x and *, respectively. All the energies are offset by a constant (the highest energy).

