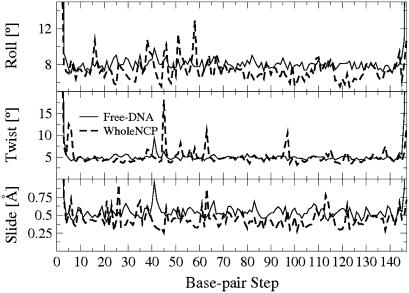
FIGURE 8.
Standard deviation of the basepair-step parameter roll, twist, and slide values for the WholeNCP-DNA (thick dashed line) and the Free-DNA (thin solid line) simulations. Values used to compute the standard deviation are from the last 500 ps of the WholeNCP-DNA simulation and that last 4.5 ns of the Free-DNA simulations.

