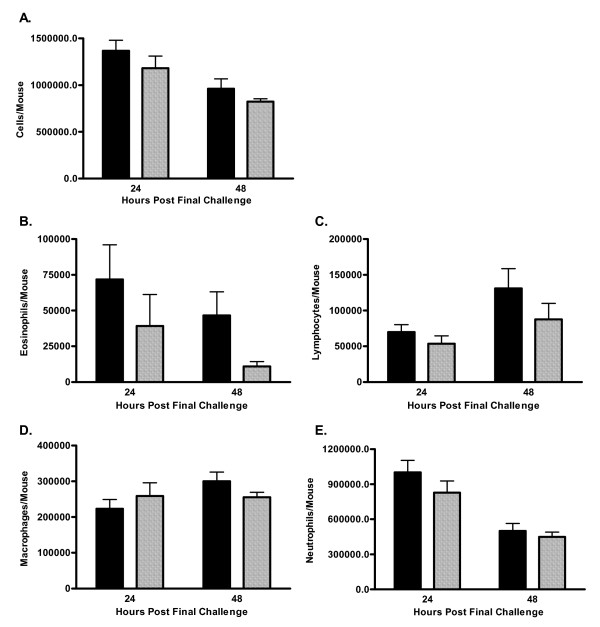
Figure 1.
BAL fluid differential. A cell differential was performed by counting of 300 cells on prepared cytospin slides from C5-sufficient (solid bars) and C5-deficient (diagonal bars) mice. A. Total Cells; B. Eosinophils, p = 0.0618 at 48-hours; C. Lymphoctyes; D. Macrophages; E. Neutrophils. Each value is the mean ± SEM for three experiments; n = 5 mice/group at 24-hours and n = 10 mice/group at 48-hours. p > 0.05 for C5-sufficient compared to C5-deficient at each time point.

