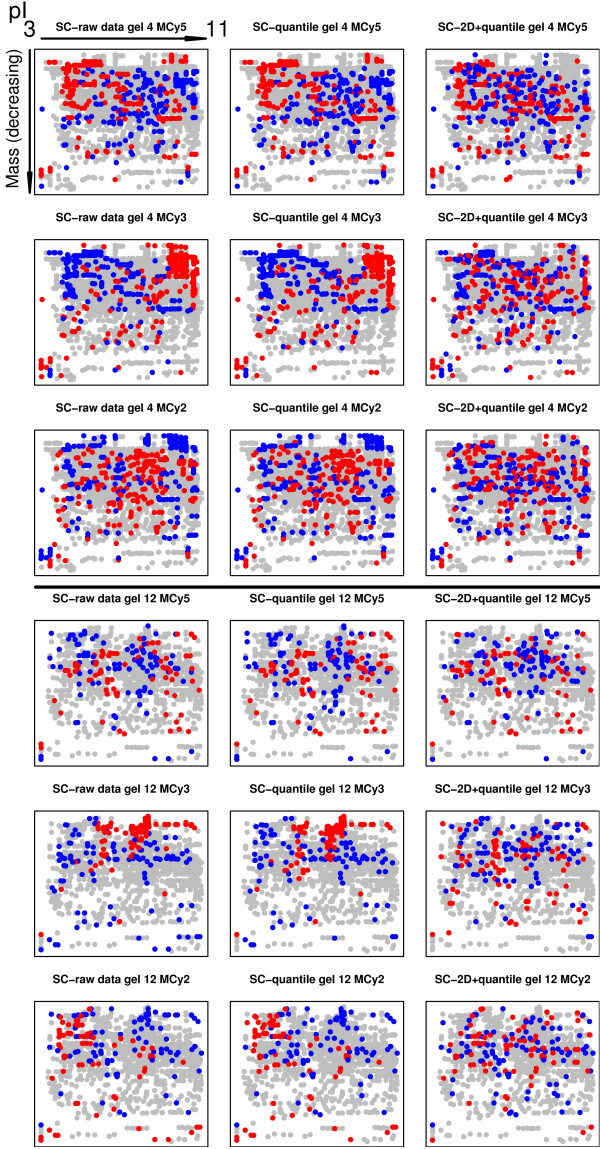
Figure 5.
2D-Intensity plots for gel 4 and 12. Spatial gel plots of Cy5, Cy3 and Cy2 intensities versus the average intensity for gel 4 and 12 before, and after normalization using different methods. Each MCy5, MCy3 and MCy2 -spot value are calculated as the Cy5, Cy3 or Cy2-value divided by the average intensity I, (log2Cy5+ log2Cy3+ log2Cy2)/3. A reconstructed gel image for gel 4 and 12 with increasing pI (left-right) and decreasing protein mass (top-down). The ten percent highest and lowest (MCy5, MCy3 and MCy2) -spot values in each gel are color coded red and blue respectively. There is a significant spatial bias in the raw data and after 'SC-quantile' normalization, which is removed using the 'SC-2D+quantile' method.

