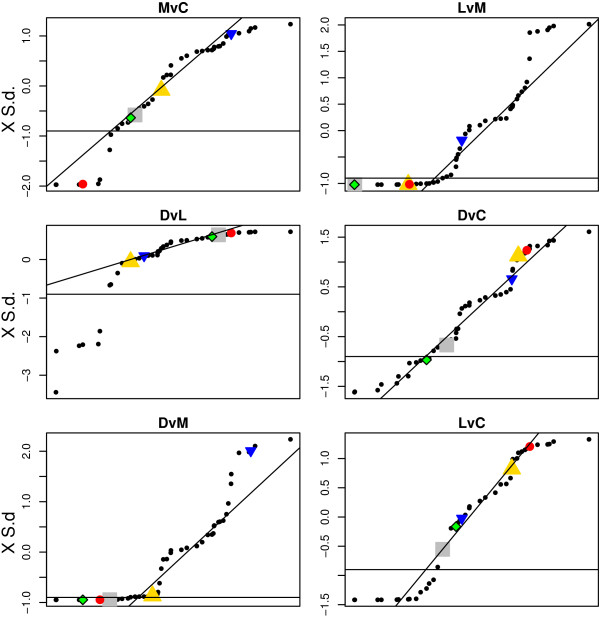
Figure 9.
QQ plots of the standardized p-values versus the standard deviation across comparisons for each protein set. For each of the six comparisons of interest a regression line is added which is based on the standardized p-values values between the first and third quartile. To assess which proteins sets that were different between comparisons we applied the same relative cut-off value of -0.9 (× S.d.) for all comparisons (black horizontal line). The three sets of proteins associated to energy metabolism (glycolysis (G), alcohol metabolism (AM) and tricarboxylic acid cycle (TCA)) were different in parkinsonian animals compared to L-DOPA treated parkinsonian animals (LvM). The closely related proteins sets for alpha and beta tubulins display different response for the LvM comparison.(Sets of: G = grey square, AM = green and black diamond, TCA = red solid circle, alpha tubulins = yellow triangle point-up, beta tubulin = blue triangle point down,)

