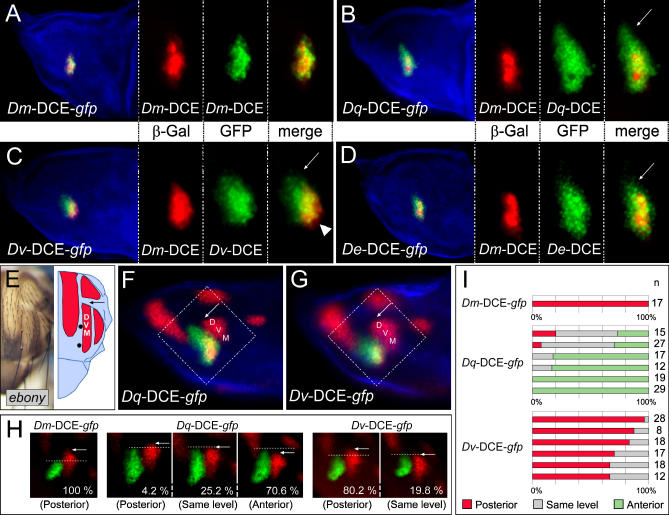
Figure 3. Detailed Comparison of the Activity of Orthologous DCEs.
(A–D) D. melanogaster wing discs expressing a cytoplasmic form of ß-Gal (red) under the control of the Dm-DCE, and a nuclear form of GFP (green) under the control of the DCE from D. melanogaster (A) D. quadrilineata (B), D. virilis (C), or D. eugracilis (D). A phalloidin counter-stain reveals actin in blue. In (B–D), the arrows point to anterior cells expressing GFP but not ß-Gal. In (C), a few posterior cells strongly express ß-Gal but weakly GFP (arrowhead).
(E) Adult hemithorax of an ebony mutant, the muscle attachment sites appear as unpigmented cuticle. The schematic drawing shows the sites of muscle attachment (red) and the DC bristles (black dots).
(F) and (G) ß-Gal antibody staining (red) revealing the expression of both sr-lacZ (enhancer trap line, nuclear signal) and of the Dm-DCE-lacZ. The expression of GFP driven by the DC enhancers of D. quadrilineata (F) or D. virilis (G) is shown in green. The regions indicated by the dashed boxes are shown in (H). In (E–G), the site of DVM 2–3 tendons is indicated (DVM).
(H) Comparison of sr expression in the DVM (red) with the activity of the DCEs of D. melanogaster, D. quadrilineata, or D. virilis driving GFP (green). The dotted lines demarcate the anterior limit of activity of the DCEs. The regions shown are in a similar position to the dashed boxes in (F) and (G). In (E–H), the arrows point to the anterior limit of the DVM. The samples in (H) correspond to three categories depending on whether GFP signal was observed posterior to, at the same level as, or anterior to the anterior limit of DVM sr expression. The percentages of discs falling into each category are indicated.
(I) The histograms detail the frequency of each category, for the DCE from D. melanogaster (one transgenic line), D. quadrilineata (six lines), or D. virilis (six lines). The numbers of discs examined per line are indicated (n).

