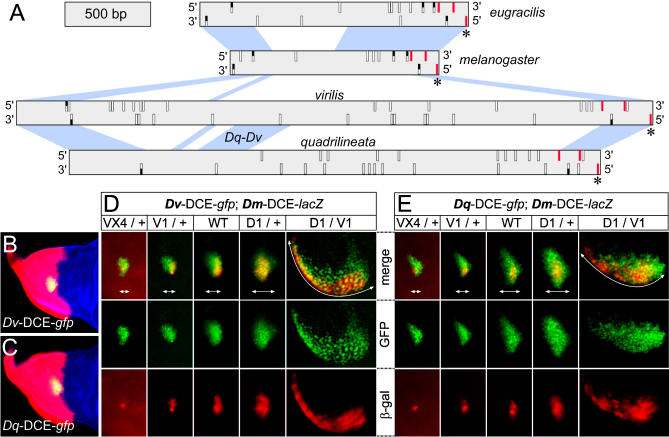
Figure 4. Divergent Enhancers Display a Similar Response to Pnr and Ush.
(A) Diagram representing the DCE sequences of D. eugracilis, D. melanogaster, D. virilis, and D. quadrilineata. The scale is shown at the top left. Only the blue regions connecting adjacent enhancers are alignable. A 300-bp region shared exclusively between D. quadrilineata and D. virilis is indicated (Dq-Dv). Small vertical rectangles symbolise all the putative GATA sites found in the forward (top) or reverse (bottom) strand. They are white when they exist only in one species, red when found in all species, and half-black when shared by two or three species. The asterisks (*) mark a conserved Pnr binding site essential for normal activity of the D. melanogaster enhancer.
(B) and (C) The D. virilis (B) and the D. quadrilineata (C) enhancers drive GFP expression (green) within the pnr expression domain, which is visualized by ß-Gal antibody staining of pnr-Gal4/UAS-lacZ wing discs (red). A phalloidin counter-stain reveals actin in blue.
(D) and (E) Activity of the D. virilis (D) or D. quadrilineata (E) DCEs driving the expression of GFP (green) in the five genotypes indicated. In all cases, the activity of the D. melanogaster DCE driving expression of a cytoplasmic form of ß-Gal (red) was used as an internal reference. White double-headed arrows delimitate the dorso-lateral width of the clusters of cells expressing GFP.
D1, pnrD1; V1, pnrV1; VX4, pnrVX4; WT, wild-type.

