
Figure 1.
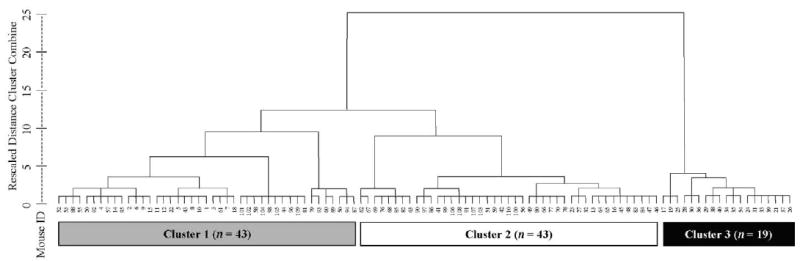
Dendogram output from the hierarchical cluster analysis of performance in the battery of behavioral tasks. The figure can be read from bottom to top as a summary of the clustering process. At each step, starting with each mouse as its own cluster, the most similar clusters are amalgamated at each stage. Cases are listed along the x-axis, while the y-axis indicates a rescaled measure of multivariate similarity in behavioral performance. When clusters are less similar to their nearest neighbors, the vertical distance between the formation of the cluster and its amalgamation will be larger. Small numbers are code numbers for each MRL-lpr male. The 3-cluster solution is emphasized by the shaded boxes at the bottom of the figure, with the numbers in each box indicating sample size of each cluster.