
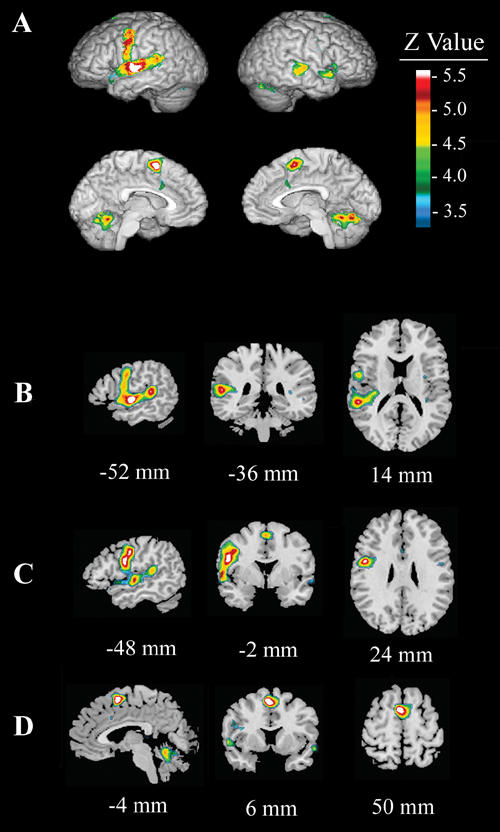
Fig. 1: Main effect of condition (Read – Look) across all subjects (patients and healthy control subjects). The figure shows (A) activation in the left motor and premotor cortices, left anterior and posterior superior temporal gyrus, bilateral supplementary motor area (SMA) and cerebellum. This image was used to draw 3 region of interests: (B) Wernicke's area (arrow; left posterior superior temporal gyrus), (C) Broca's area (anterior and inferior frontal focus), and (D) left and right SMA regions.