
Fig. 1.
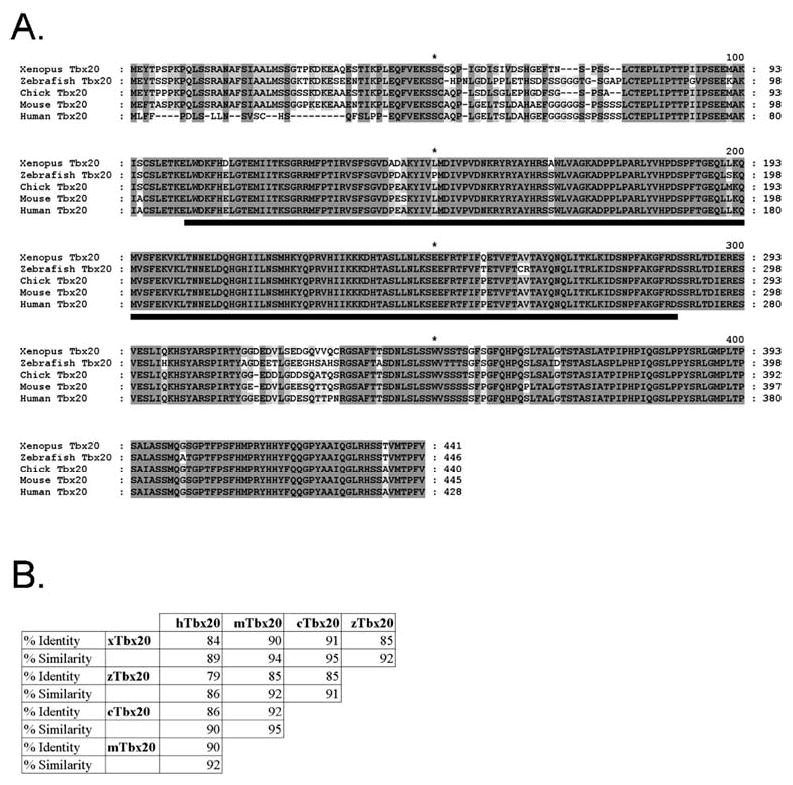
A, B Comparative sequence analysis of TBX20. Analysis was performed with the GeneDoc program. A Alignment of vertebrate TBX20 proteins. Fully conserved amino acids including those containing conservative substitutions are shaded in dark gray. Lighter shading represents lower conservation. The conserved T-box domain is underlined in black. B Vertebrate TBX20 amino acid conservation. The percentage of identical amino acid residues (identity) and the percentage of conservative substitutions and identical residues (similarity) are given for comparison between TBX20 proteins. TBX20 prefixes: x, Xenopus; z, zebrafish; c, chicken; m, mouse; h, human