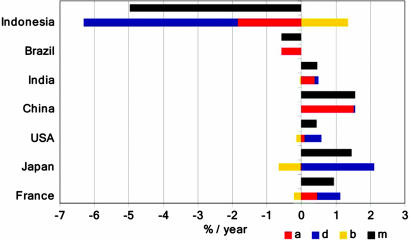
Fig. 3.
Depicted during 1990–2005 in each of seven countries are the rate of change of total above-ground biomass (m) (upper bars) and (lower bars), the contributions of changing area (a), growing stock density (d), and biomass (b) per volume of growing stock that summed to change (m) (source, ref. 4).

