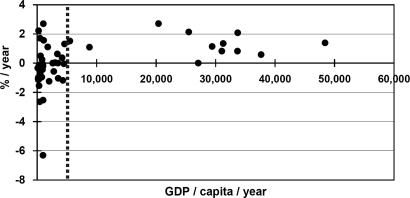
Fig. 4.
The average annual change a + d of growing stock in nations plotted as a function of their GDP per capita. The vertical line marks $4,600. The change in growing stock was measured during 1990–2005 and the GDP in U.S. dollars in 2003. The vertical axis expresses the rate of growing stock change. The nations depicted are those with the most growing stock reported in 2005, except French Guiana and Myanmar, for which GDP was lacking. Canada reported identical forest area and no change in growing stock from 1990 to 2005 (4, 34).

