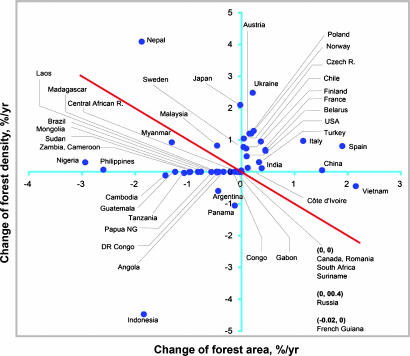
Fig. 5.
A synoptic chart of changing forests during 1990–2005 in the 50 nations with the most growing stock reported in 2005. On the chart, the horizontal axis or longitude is the relative change of forest area (a), and the vertical axis or latitude is the relative change of growing stock density (d). Volume (v) was positive in nations above the diagonal line, a = −d, because growing stock was increasing.

