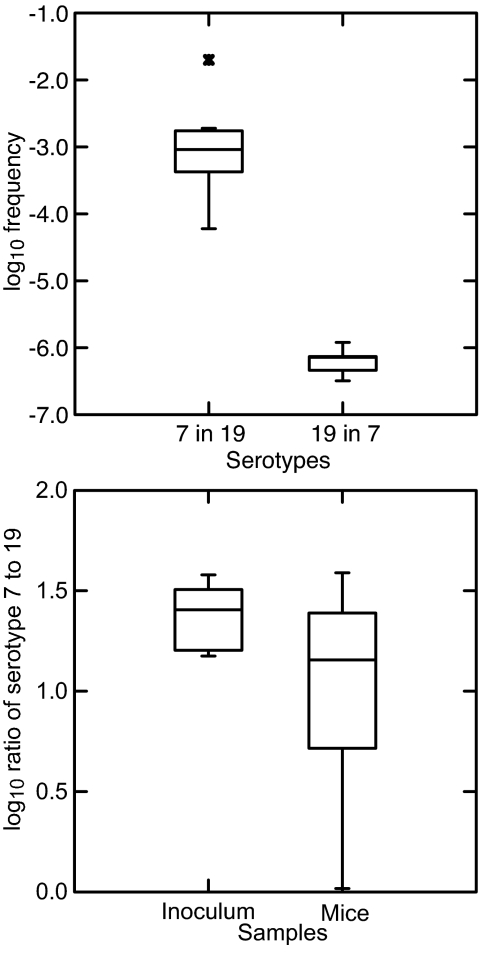
Fig. 3.
Quantitative PCR assays for serotypes 7 and 19 in mouse infections. (Upper) Box-and-whisker plots, which give the median, first, and third quartiles, and 1.5 times interquartile range, of log10 frequencies of serotype 19 in serotype 7 populations (n = 5) and of serotype 7 (n = 8) in serotype 19 populations in the blood of immunodeficient mice that had detectable amounts of both serotypes (Table 2). (Lower) Box-and-whisker plots of log10 ratios of serotypes 7–19 in five samples of the plasma inoculum and in blood samples recovered from each of 10 immunocompetent mice infected with the mixture.

