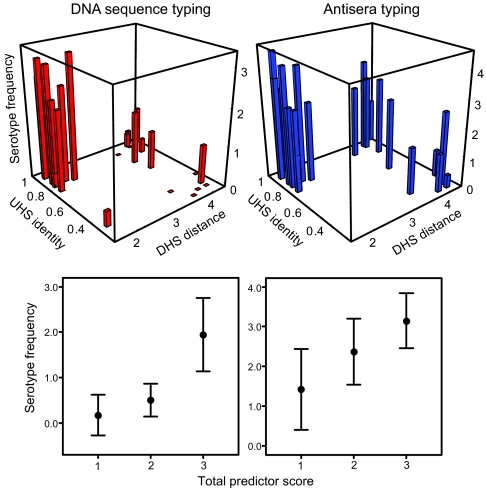
Fig. 4.
UHS and DHS elements are determinants of serotype switch rates in B. hermsii. (Upper) More frequent serotypes in relapses have high UHS identity and are close to a DHS element. The height (z axis) shows loge of frequencies per 100 immunocompetent mice for each variant; frequency depends on the fraction of UHS nucleotide identity and log10 of the minimum distance to the nearest downstream DHS element. Results shown separately for the DNA sequencing experiment (red; 27 variants; Table 4) and the antisera typing experiment (blue; 22 variants). The general linear model correlation coefficients for variant frequency regressed on UHS identity and DHS distance were 0.64 (F2 = 8.41; P = 0.002) for the DNA set and 0.66 (F2 = 7.23; P = 0.005) for the antisera set. (Lower) Loge of the relapse frequency per 100 mice vs. the total predictor score, defined as follows: 1, UHS identity <0.6 and log10 DHS distance ≥2.5; 2, UHS identity ≥0.6 or DHS distance <2.5; and 3, UHS identity ≥0.6 and DHS distance <2.5 (Table 4). We chose this scoring system to separate the clearly defined groups (Upper). Spearman correlation coefficients (95% confidence intervals) between total predictor score and loge of variant frequency per 100 mice were 0.67 (0.43–0.92; P = 0.0002) for DNA sequence typing and 0.62 (0.36–0.89; P = 0.002) for antisera typing.

