
Figure 1.
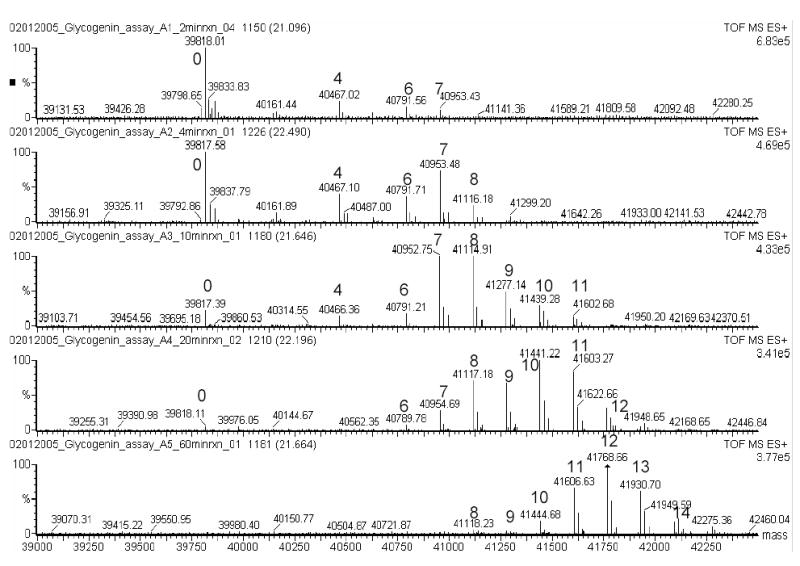
Representative deconvoluted mass spectra for the molecular species with masses between 39,000 and 42,500 daltons as a function of time (2, 4, 10, 20 and 60 minute time points, top to bottom, respectively). Species corresponding to different glucosylated forms of glycogenin are label according to the number of glucoses attached (eg, ‘0’ refers to the non-glucosylated form and ‘4’ refers to the species with four glucose residues attached).