Figure 3.

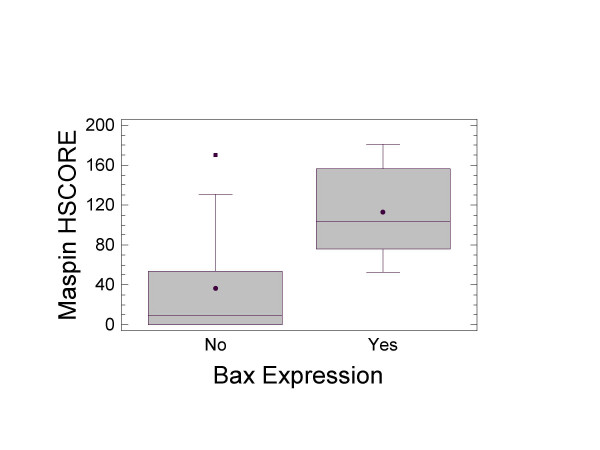
Box-and-whisker plot for the presence or absence of Bax expression versus Maspin HSCORE. The solid black circles represent the mean values. The solid black represent outlier patients with Maspin HSCORE outside the 95% CI.

Box-and-whisker plot for the presence or absence of Bax expression versus Maspin HSCORE. The solid black circles represent the mean values. The solid black represent outlier patients with Maspin HSCORE outside the 95% CI.