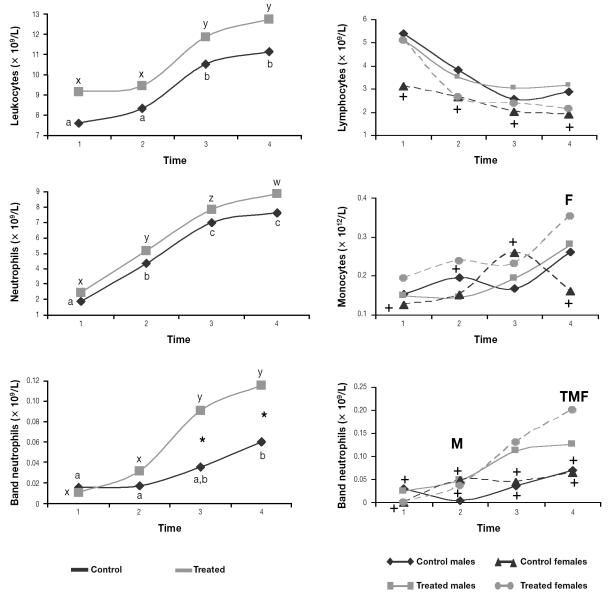
Figure 3.
Mean leukocyte parameters for the 40 animals. Asterisks indicate significant differences (P < 0.05) between the control and treated groups. Crosses indicate that the means were stable for the group, and T, M, and F indicate significant differences between the treated, male, and female groups, respectively.

