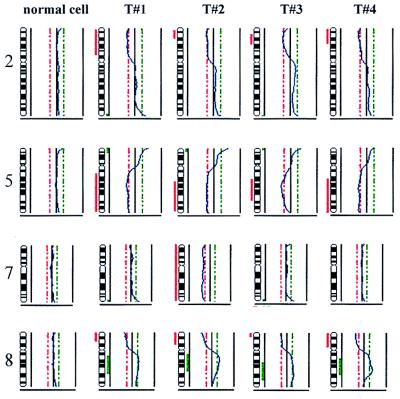
Figure 6.
CGH profile of four single tumor cells (T#1–T#4) and one normal cell of a patient with CUP syndrome. Chromosomes 2, 5, 7, and 8 were chosen for comparison of identical and divergent findings. The losses on chromosomes 2, 5, and 8p were common for all tumor cells as was the gain of 8q whereas the loss of chromosome 7 was only seen for T#2. As in the other profiles, chromosomal losses are marked by red vertical bars at the left side of the chromosome symbol, and gains are marked by a green bar on the right side.

