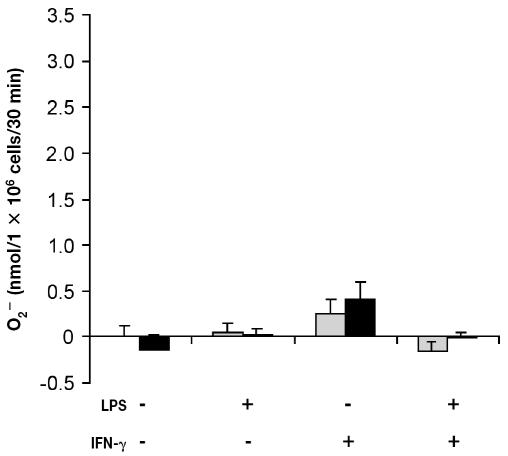
Figure 4.
Superoxide production by bovine monocytes in inflammatory conditions. Cells were isolated from bovine blood and incubated as described for Figure 3. The cells were washed, and O2− production by PMA-stimulated cells (black bars) and unstimulated cells (grey bars) was measured. Data represent the mean for 3 cows; each treatment was performed in triplicate.

