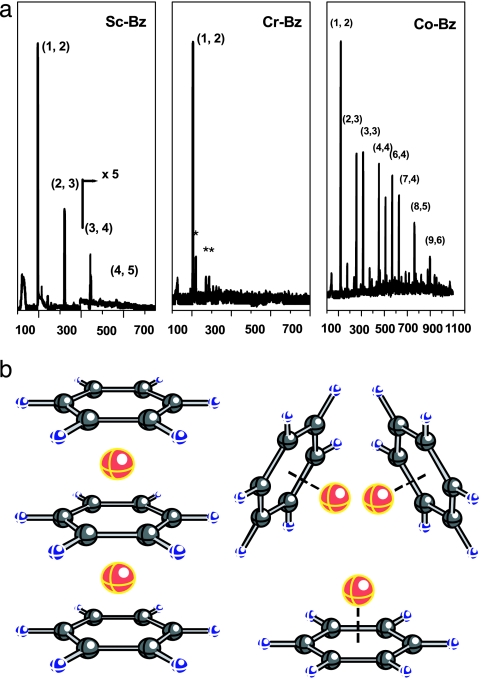
Fig. 9.
Mass ion intensity and structure of metal–benzene complexes. (a) Mass ion spectra of Sc-Bz (Left), Cr-Bz (Center), and Co-Bz (Right) complexes (127). [Image in a reprinted with permission from ref. 127 (Copyright 1999, American Chemical Society).] (b) Sandwich and rice ball structures of metal–Bz complexes (136). [Image in b reprinted with permission from ref. 136 (Copyright 2001, American Chemical Society).]

