
Figure 7.
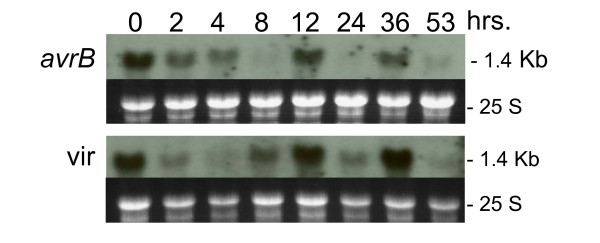
Flavanone 3-hydroxylase (F3H) RNA (1.4 kb) profile. Measurements made at 8 intervals through a 53 hr period in response to infection by Pseudomonas syringae pv glycinea with avrB (avrB) or without (vir) (First and second panels respectively). Dark background sub-panels are the 25 S ribosomal RNAs from corresponding ethidium bromide-stained gels prior to membrane transfer and shown to compare sample loading. Gm-c1012-683 soybean cDNA clone was used as probe.