
Figure 3.
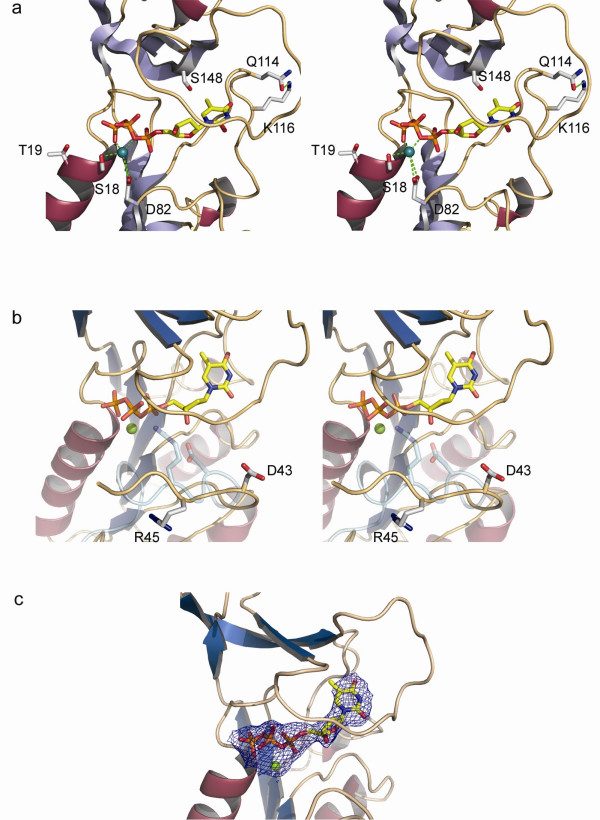
a. Stereo-diagram highlighting the positions ofresidues studied in site-directed mutagenesis experiments of VVTK. Side chains subjected to mutation are shown in grey. b. Stereo-diagram showing the different conformations of residues Asp-43 and Arg-45 in subunit D of VVTK and the equivalent hTK residues colored in cyan. c. Diagram showing the final 2fo-fc map contored at 1σ for dTTP and magnesium. Color coding for the protein secondary structure is as for Fig 2a.