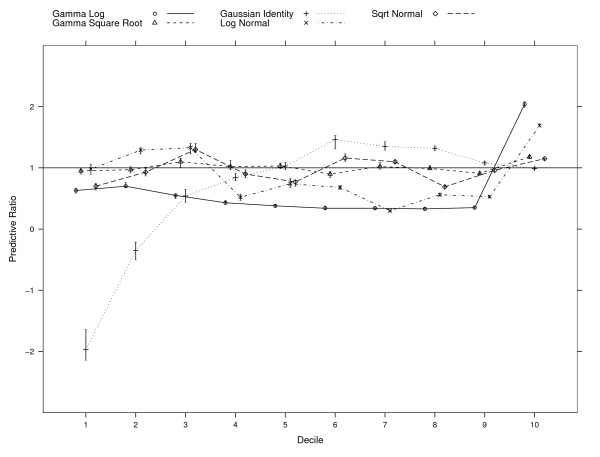
Figure 1.
Predictive ratios (PR) per decile of predicted cost in full sample (N = 525,620). PR is computed as the ratio of predicted cost to observed cost for deciles of predicted cost. For each decile, PR = 1 when mean predicted cost equals mean observed cost. Also shown, are 95% bias-corrected bootstrap confidence intervals.

