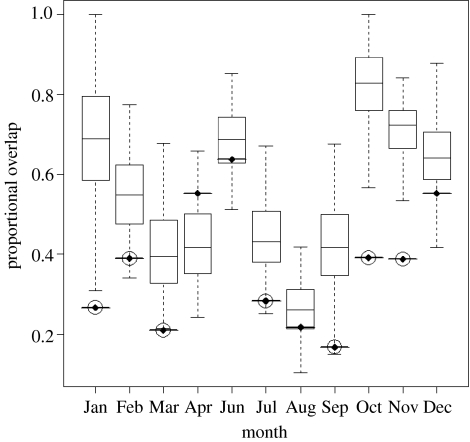
Figure 3.
Box plots of randomization results for each month (except May due to limited data). Box plots and error bars are normalized overlap for 200 permutations where the sex of each track was randomly assigned. The observed overlap is indicated by the bold bar with diamond centre. Observed overlaps that are significantly different (p≤0.01) from the population of random overlaps are circled.

