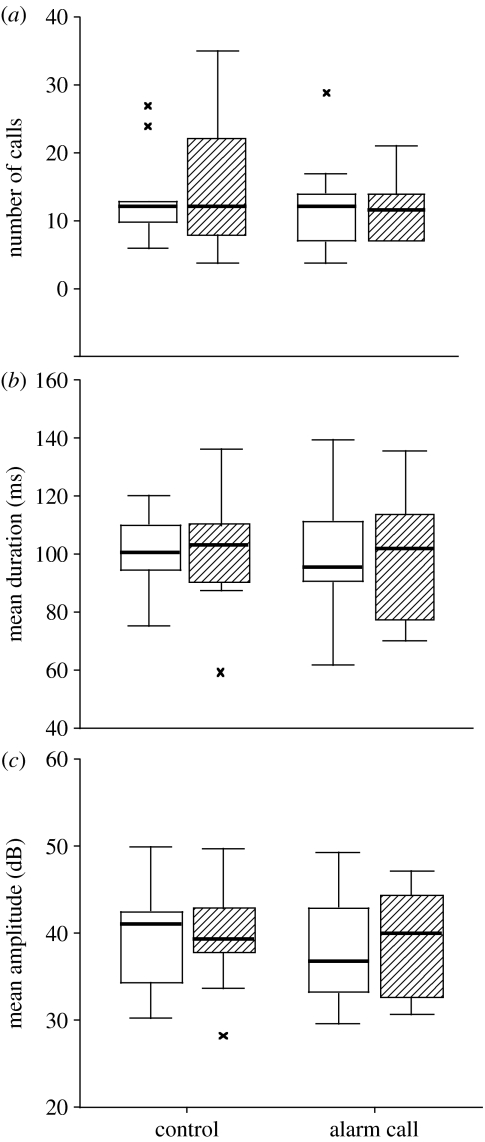
Figure 3.
The response of nestlings to playback: (a) the number, (b) mean duration and (c) mean amplitude of ‘peep’ calls given by nestlings in a 10 s period before (open bars) and after (shaded bars) playback of control sounds or aerial alarm calls. The figure shows box plots in which the heavy line is the median, the boxes show the inter-quartile range and crosses are more extreme values; n=10 groups.

