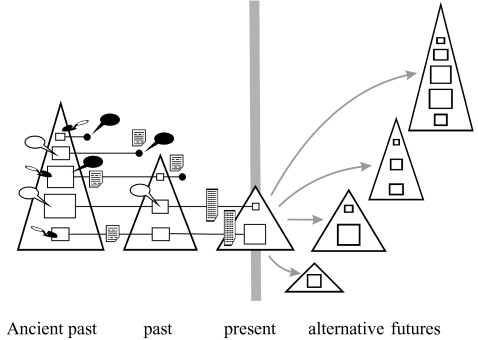
Figure 1.
Diagram illustrating the BTF concept for the restoration of past ecosystems. Triangles at left represent a series of ecosystem models, constructed at appropriate past times, where the vertex angle is inversely related and height directly related to biodiversity and internal connectance. Time-lines of some representative species in the models are indicated, where box size represents relative abundance and filled circles represent local extinctions. Sources of information for constructing and tuning the ecosystem models are illustrated by symbols for historical documents (paper sheet symbol), data archives (tall data table symbol), archaeological data (trowel), the traditional environmental knowledge of indigenous peoples (open balloons) and local environmental knowledge (filled balloons). Alternative future ecosystems, restored ‘Lost Valleys’, taken as alternative policy goals, are drawn to the right (modified from Pitcher et al. 1999 and Pitcher 2001).

